Business Dashboard Development: Key Components for Better Insights
Every growing business today collects enormous amounts of data. Sales numbers, marketing performance, inventory levels, customer behaviour, and finance records are all being captured somewhere. Yet most business owners and managers still make decisions based on gut feeling, delayed reports, or Monday morning spreadsheet reviews.
The problem isn’t a lack of data. It’s the lack of a system that makes data readable, actionable, and available in real time. That’s where business dashboard development becomes not just useful – but essential.
A poorly designed dashboard creates more confusion than clarity. A well-built one becomes the single most important screen in your business. So what separates one from the other? Let’s break it down.
What Happens When Businesses Run Without Dashboards
Without a proper dashboard, businesses typically experience:
- Decision-making based on outdated weekly or monthly reports
- Multiple teams working from different versions of the same data
- No early warning system for problems – issues are discovered after the damage is done
- Hours wasted every week manually pulling data from disconnected tools
- Leaders flying blind on performance until it’s too late to course-correct
These aren’t small inconveniences. Poor data visibility directly impacts revenue, efficiency, and growth. Research consistently shows that companies using real-time performance tracking outperform those that don’t – across every industry.
What Is a Business Dashboard?
A business dashboard is a visual, interactive display that consolidates data from multiple systems into a single unified view – giving decision-makers a live picture of how the business is performing at any given moment.
Think of it as your business’s control panel. Just like a pilot doesn’t manually calculate altitude mid-flight, your dashboard surfaces what matters most – automatically, clearly, and without noise.
Where business dashboards are used:
- Executive and leadership teams tracking company-wide performance
- Sales teams monitoring pipeline, targets, and conversion
- Operations teams overseeing fulfilment, logistics, and efficiency
- Finance teams watching cash flow, margins, and expenses
- Marketing teams measuring campaign performance and lead generation
- HR teams tracking attrition, hiring, and utilisation
How a Business Dashboard Works?
A dashboard works by connecting to your existing data sources – CRM, ERP, marketing platforms, databases – through APIs and data pipelines. Once connected, it pulls data continuously, processes it, and displays it in visual formats that make patterns and trends instantly readable.
The core mechanism:
- Data ingestion – pulls data from connected systems automatically
- Data processing – cleans, structures, and calculates metrics in real time
- Visualisation layer – presents data in charts, graphs, scorecards, and tables
- Access control – shows each user only the data relevant to their role
- Alerts and notifications – flags anomalies or threshold breaches automatically
This is what a real-time analytics dashboard actually does under the hood – it’s not just a pretty chart. It’s a live data engine connected to your entire business.
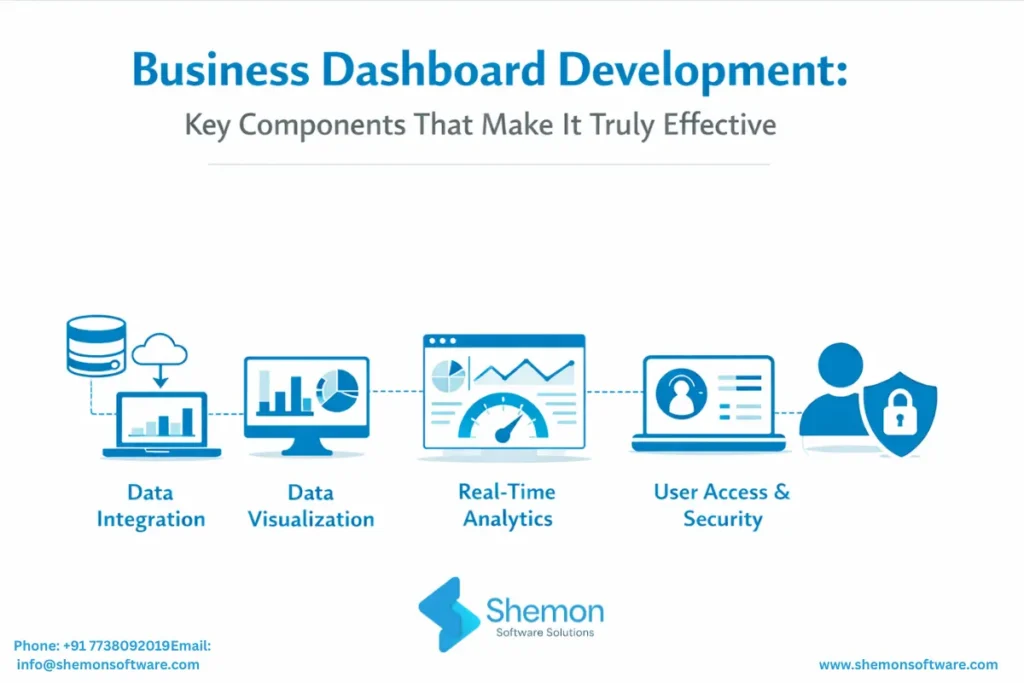
Key Components That Make a Dashboard Truly Effective
The Right KPIs – Not All of Them
More data does not mean more insight. The most common dashboard mistake is trying to show everything at once. Effective KPI dashboard components are chosen based on one filter: does this metric help someone make a decision or take an action?
Smart Data Visualisation
The right visual format makes a metric instantly understood. The wrong one makes people ignore it. Following data visualisation best practices means matching chart types to the kind of insight you’re communicating:
- Line charts – trends over time
- Bar charts – comparisons across categories
- Gauge charts – progress toward a single target
- Scorecards – single KPIs with comparison to target or prior period
- Funnel charts – drop-off across a process like sales or onboarding
- Heat maps – patterns across two dimensions
Role-Based Access and Personalised Views
A CEO and a customer support agent need completely different information. A truly effective business intelligence dashboard is not one screen for everyone – it’s a system where each user sees exactly what’s relevant to their role.
Seamless System Integration
A dashboard is only as powerful as the data feeding it. If your team manually exports from five tools every Monday to update a spreadsheet, that’s not a dashboard – that’s a slow report with extra steps.
Why Generic Tools Often Fall Short
Off-the-shelf tools like Power BI and Tableau work well for standard reporting. But businesses with complex workflows, proprietary systems, or cross-department reporting needs will quickly hit their limits.
Custom dashboard software built by an experienced team gives you:
- Dashboards designed around your exact business logic
- Integration with legacy or proprietary systems that generic tools can’t connect to
- Your brand, your terminology, your team’s specific workflows
- The ability to scale and extend as your business grows
This is why partnering with a reliable custom software development company makes a significant difference – especially when your reporting needs go beyond what templates can handle.
For larger businesses managing operations across multiple departments, dashboards built within ERP software development services take this even further – connecting finance, inventory, HR, and operations into a single source of truth.
And for businesses scaling on cloud-based platforms, working with an experienced SaaS application development company ensures the dashboard is built for performance, uptime, and scale from day one.
Why Choose Shemon Software Solutions?
Building a dashboard is easy. Building the right one takes experience. Here’s why businesses trust Shemon:
We Start with Your Business, Not the Code
- Discovery-first approach – we understand your goals before touching technology
- KPIs mapped to your actual business decisions, not generic templates
- Full audit of your existing systems before we build anything
Real Experience Across Real Industries
- Healthcare, e-commerce, SaaS, therapy platforms, and operations businesses
- Dashboards built for real users – not just for demos
We Build for Adoption, Not Just Delivery
- Role-based views designed around how each team actually works
- Clean, simple interfaces your team will actually use daily
- User testing and iteration before final delivery
We Stay After Launch
- Ongoing support, metric updates, and feature additions
- A long-term technology partner – not a one-time vendor
FAQs
When standard tools cannot reflect your actual workflow, KPIs, or system integrations.
A report is static and delayed. A dashboard is live, interactive, and always up to date.
Yes. A modern dashboard can pull data from CRM, ERP, Accounting software, Marketing Tools, databases, and show everything in one place.
It depends on the number of data sources, user roles, and complexity of KPIs. Most projects are delivered in a few weeks to a few months.
Yes. They can be embedded directly into your existing system for a single source of data.
Conclusion
An effective business dashboard is not a screen full of charts. It’s a decision-making tool, one that gives every person in your organisation the clarity, context, and confidence to act on real information rather than guesswork.
Get the KPIs right. Connect your systems. Design for the person using it. Make it live. Do those four things well, and your dashboard stops being something your team checks occasionally, and becomes something they can’t work without.
At Shemon Software Solutions, we design and build custom dashboards, business intelligence platforms, and real-time reporting systems for growing businesses across industries, from healthcare to e-commerce to SaaS.
Tags
Custom software development company
SaaS application development company