See your business in one clear, real-time dashboard
Connect your tools, automate reporting, and track leads, revenue, operations, and efficiency in one unified view, without manual spreadsheets.


Teams That Need Analytics & Reporting Dashboards
This service is for if:
Reports are created manually every week or month
Teams track numbers across different spreadsheets and tools
Leadership doesn’t have a single source of truth
Important metrics are difficult to access when decisions are needed
You don't have real time visibility into performance. You lack real-time visibility into performance and bottlenecks
Core Services
Our Web & Mobile App Development Includes:

Custom Business Dashboards Growth audit
leadership, team, role-based views

Automated Reporting
daily/weekly/monthly without manual compilation

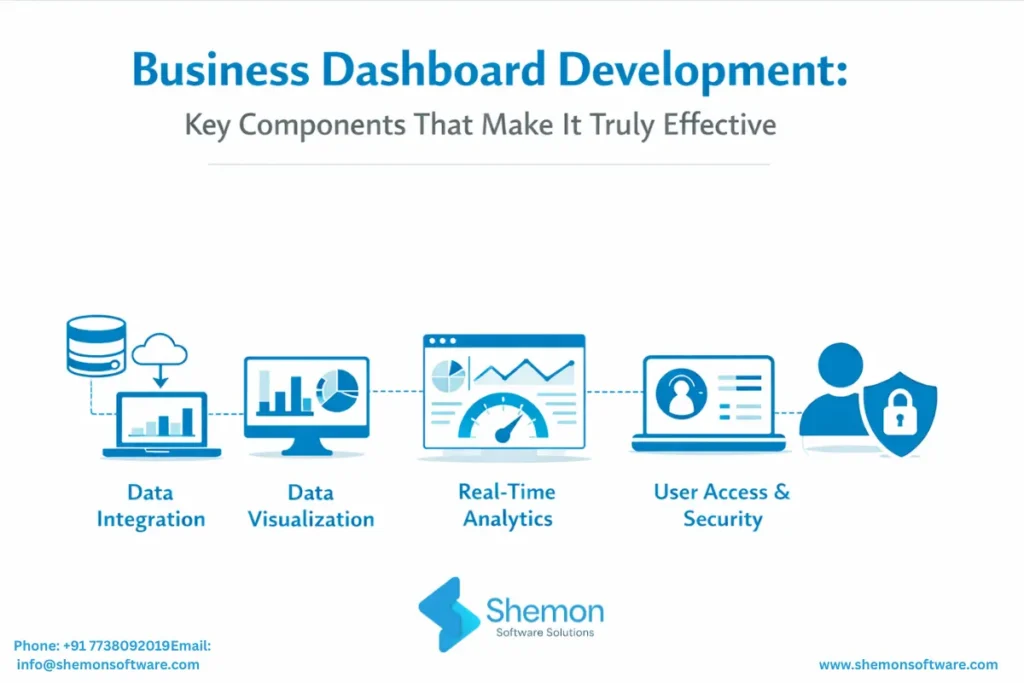
Data Consolidation
from multiple tools into one view

Performance Insights
trends, bottlenecks, drop-offs, and action points
How We Build Dashboards - That Team Actually Use
Define Metrics that Matter
We identify key KPIs, owners, reporting cadence, and the decisions the dashboard must support.
Validate Accuracy + Usability
We test data accuracy, edge cases, and dashboard usability with real users.
Dashboard Blueprint
We design clear role-based views (leadership vs managers vs teams) and define drill-downs.
Data Integration
We connect systems, standardise
fields, and build reliable data flows.
Ongoing Enhancements
We improve dashboards as your processes, teams, and tools evolve.
Work With The Tools You Already Use
We integrate dashboards with any tool that has exports, APIs, or database access.
CRM & sales tools
Website + analytics data
Ad platforms (Google/Meta, etc.)
Operations tools - tickets, tasks, SOP systems Recruitment / HR systems (if needed)
Finance tools (optional)
Internal databases and third-party APIs

What Our Clients Say About Us
Sheetal and Mona worked closely with the team to understand their clinical workflows and translate them into a structured digital platform.They built a secure, compliant system that gives therapists real-time data access and keeps families connected.The result is more efficient operations and the ability to scale care delivery to thousands of families.
Working with Sheetal, Mona, and the Shemon team, the website was completely transformed to reflect the client’s global positioning and expertise.They built a fast, conversion-focused platform with strong SEO and clear user journeys.Today, the system consistently attracts qualified inquiries and acts as a scalable foundation for growth.
Working with Sheetal, Mona, and the Shemon team, the campaign was executed with strong strategic clarity and continuous optimisation.They combined precise targeting with transparent tracking to ensure performance at every stage.The result was measurable business impact, real demand generation, and a stronger market presence.
Sheetal and Mona took the time to deeply understand the organization’s mission, programs, and communities. They executed a structured approach across content, lead generation, verification, and donation systems. The result is a strong digital presence that is reaching more donors and volunteers than ever before.
Engagement Model
Reporting Discovery & KPI Planning
Defining your metrics
- Identify key KPIs
- Map data sources
- Design dashboard structure
- Define reporting cadence
- Reporting roadmap
Dashboard Development & Data Integration
Building real-time dashboards
- Custom team dashboards
- Data source integration
- Automated reporting setup
- Performance visualization
- Accuracy & usability testing
Reporting Optimization & Expansion
Scaling your reporting
- Add dashboards & KPIs
- Expand tool integrations
- Advanced analytics insights
- Monitor performance
- Continuous improvements
Pricing is customized for every project and defined after understanding your requirements, scope, and goals.
Frequently Asked Questions
Yes. We integrate CRMs, ad platforms, websites, ops tools, and databases to create a unified, real-time view.
No. Reporting is automated based on your cadence-daily, weekly, or monthly-with zero spreadsheet compilation.
We standardize data sources, validate logic with real scenarios, and test before go-live so leadership can trust every number.
Yes. Role-based views ensure leadership, managers, and teams each see the metrics relevant to their decisions.
Absolutely. We continuously enhance them as your processes, KPIs, and tools change.

The Latest Blogs & Articles

We will discuss this problem-wise and not industry wise